1.2. Design view
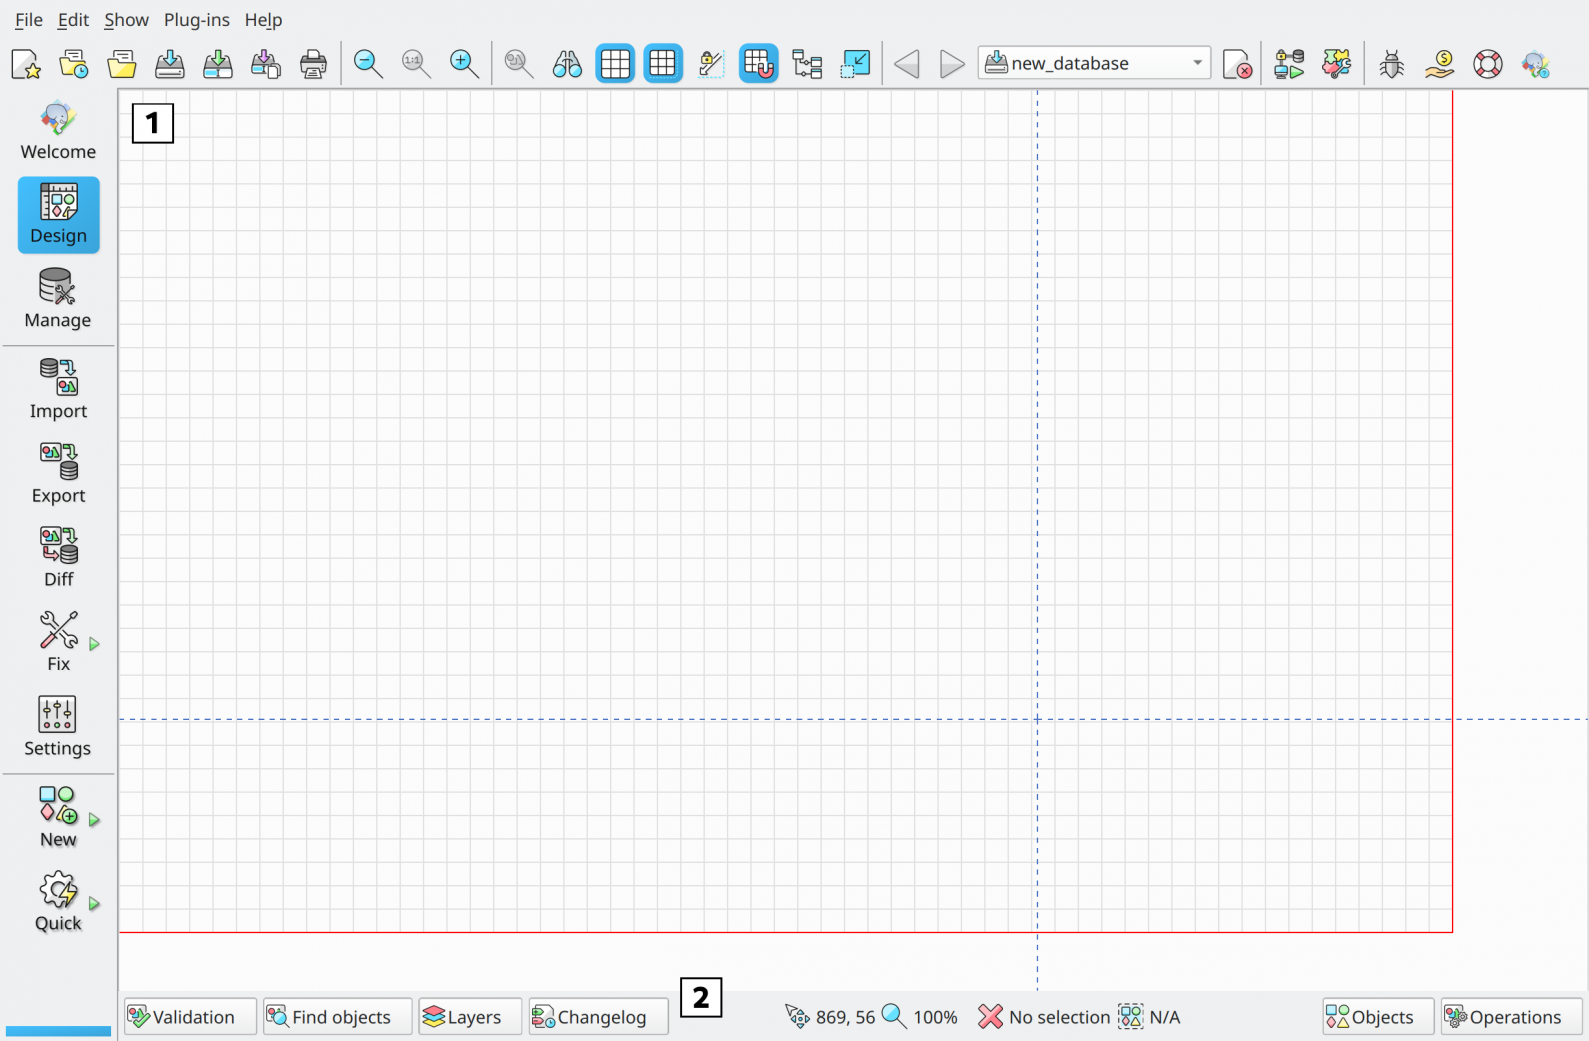
The design view contains only two subsections (see image) and they are described as follows:
-
Canvas area: this area is used to draw model objects like tables, views, text boxes, and relationships. The dashed blue lines are the page delimiters representing the paper limits (according to the paper size configured) and they serve as a guide preventing objects to be cut when printing the model. The red lines at the edges are the canvas boundaries and denote the current maximum size of the drawing area. This size is always updated whenever objects are moved in the canvas.
-
Toggle buttons: these buttons activate some advanced widgets. These tools are the model validation, object finder, layers management, model changelog, executed operations, and model objects. A detailed description of each one can be seen in the next sections. Additionally, between the toggle buttons, we have a set of information about the current state of the canvas which is, from left to right, the mouse pointer position (in canvas' coordinate), the current zoom factor, the current selection and the overall width/height of the current selection.